PolicySpace
Transit Demand Model
Francis Tseng
@frnsys
About me: Simulation, machine learning

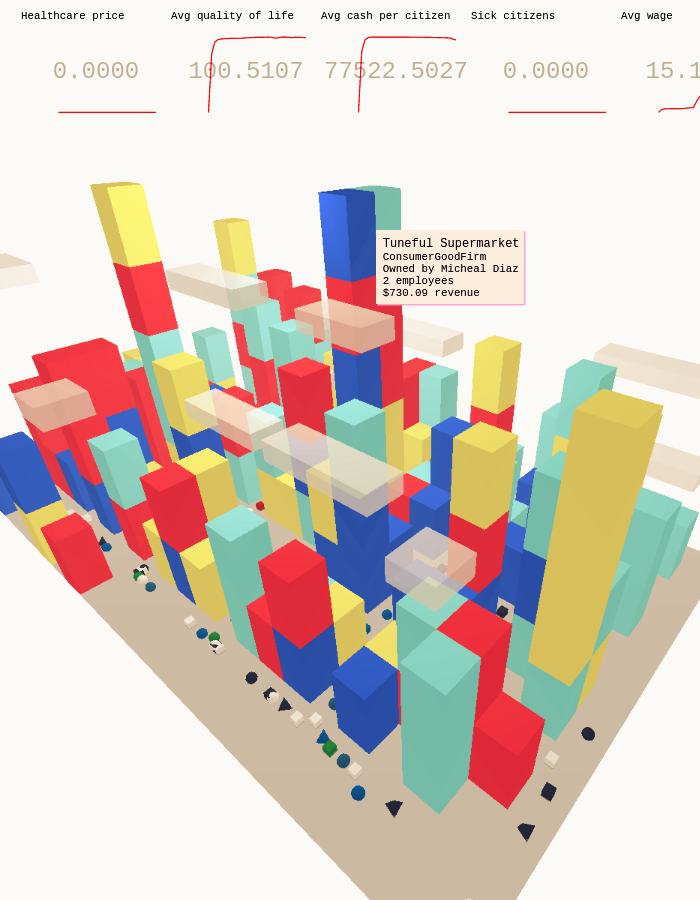
PolicySpace
Spatial economic agent-based model developed at the Institute for Applied Economic Research (IPEA) under Bernardo Alves Furtado.
Simulates labor, housing, and goods markets and a tax scheme for 46 Brazilian metropolitan regions.
Wanted to expand it to model how these effects might impact transit.
We take into account how things like spatial distance might influence a decision to work at one firm or another, but we just looked at the distance and not for example something more nuanced like commute times.
Transit demand: how do people get from A to B?
at its core, the most important thing for our model was figuring out how people get from some point A to point B, that is, what routes will they take? This lets us know how roads are used, which buses and subways and so on need more capacity, how travel times are affected, and so on.
Caveat: I'd never worked on any sort of transit simulation before, and the goal wasn't to develop a very rich and deep one but explore the possibilities there and come out with a prototype of some kind. I quickly got up-to-speed about OSM, GTFS, and various trip planning algorithms.
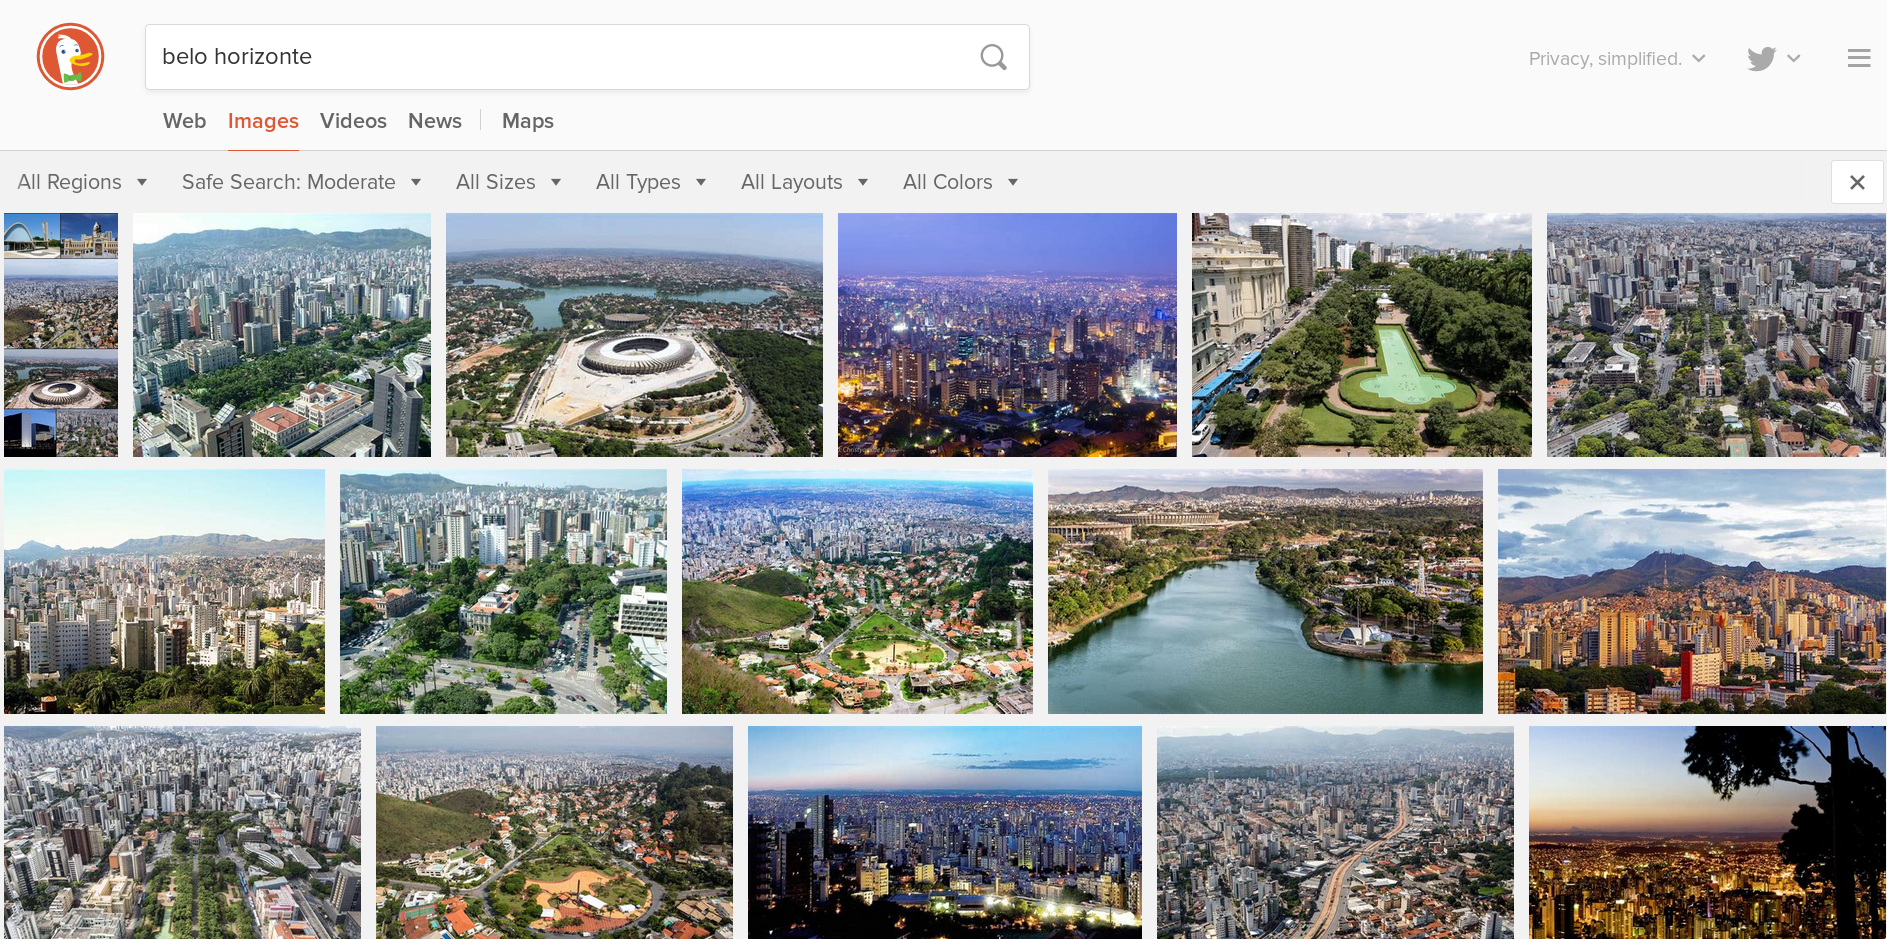
We decided to first focus on Belo Horizonte, the sixth-largest city in Brazil with a metropolitan population of about 5.1 million which had GTFS data available for it.
Overview
- Use discrete event, agent-based simulation
- Treat roads as FIFO queues (no passing)
- Treat space as continuous (i.e. no zones)
- Only consider work commutes (trips to/from place of employment)
- Exclude events such as accidents
- Model both public and private transit
- Private transit routing: A*
- Public transit routing: CSA
To give an overview of the system, we used discrete event, agent-based simulation (described later).
We treat roads as first-in-first-out queues, which is a simplifying assumption where vehicles can't overtake one another in roads. It reduces the calculations required so it gives a performance improvement, but obviously is a pretty crude assumption to make and can be replaced further on.
We treat space as continuous; that is, we don't break it up into zones; we model it as point-to-point transit.
We only consider work commutes because that is the only trip schedule information the PolicySpace model generates. Later on we could put in some placeholder model for non-work trips but that wasn't important at the start.
We don't consider traffic exceptions like accidents, though we plan on adding that in later.
We wanted to model both public and private transit to see how they interact. For private transit routing we used A-star planning, and for public transit routing we use the connection scan algorithm (CSA).

Agent-based modeling
In agent-based modeling, we describe the behaviors of individual components of the system (e.g. people, or here, birds) and aim to reproduce the higher-level/aggregate behaviors through the interactions of these individual behaviors. This is in contrast, for example, to equation-based modeling where we might have a handful of equations that describe the system from a high-level/top-down view.
In this example here, we have some convincing flocking behavior, but we don't have an equation describing the behavior in aggregate.
Instead, we program the behaviors of birds individually, and when we make a lot of them, this higher-level order emerges.
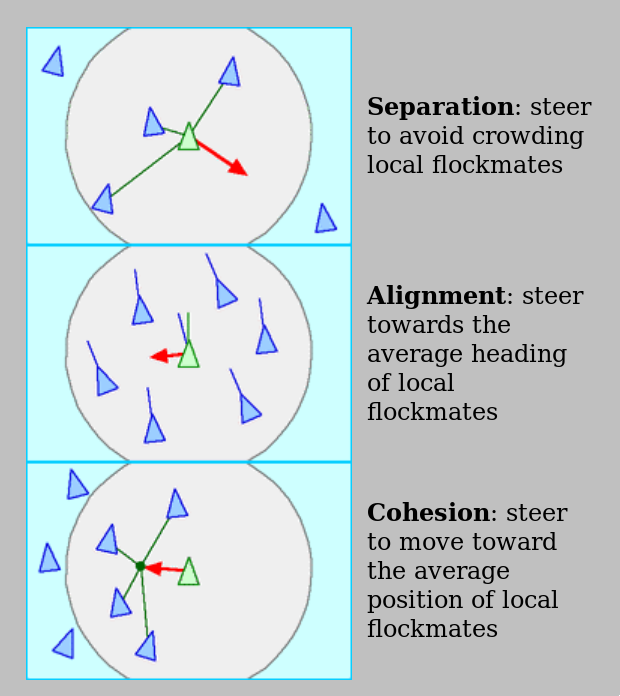
these are the simple agent rules that lead to that flocking behavior.
in our case it's even simpler, since the agents (passengers) just mindlessly execute the route we plan for them.
Discrete event simulation
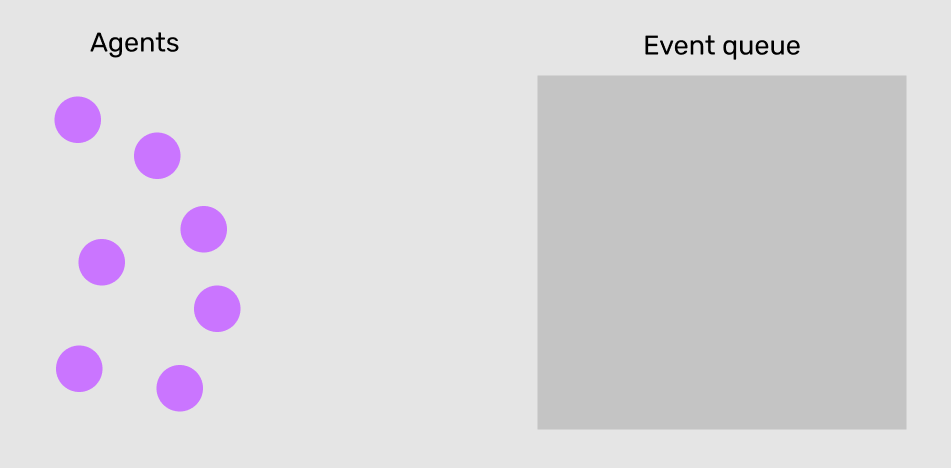
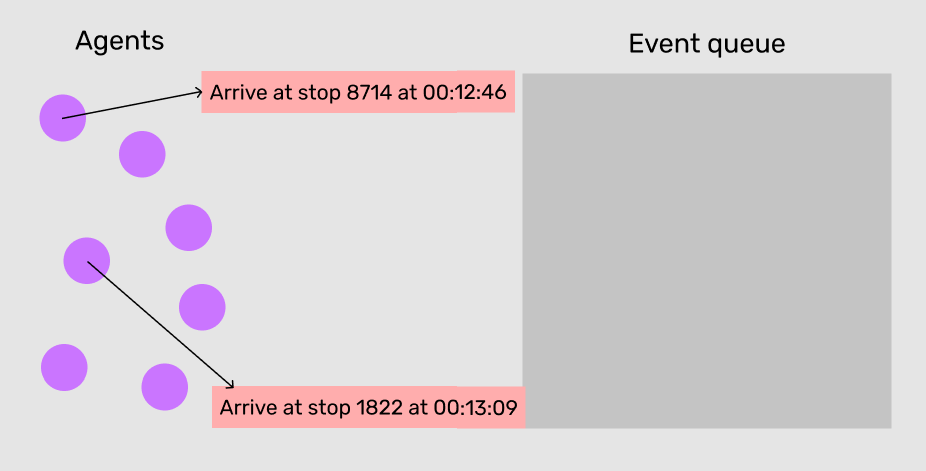
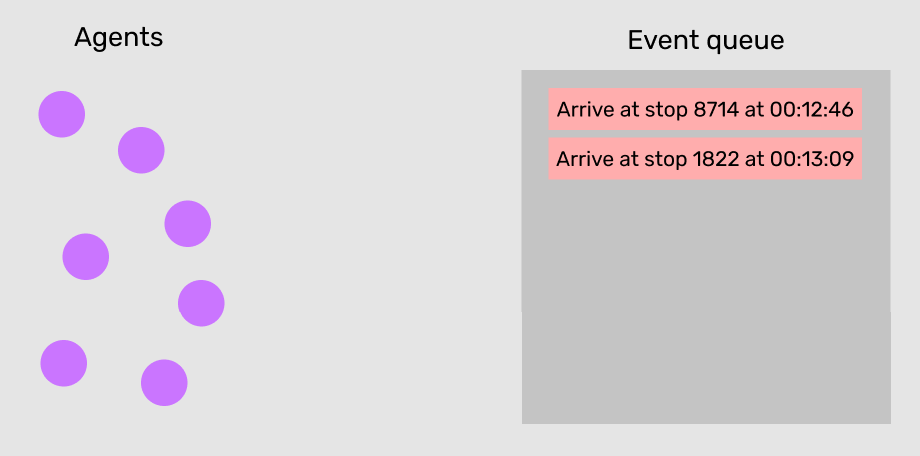
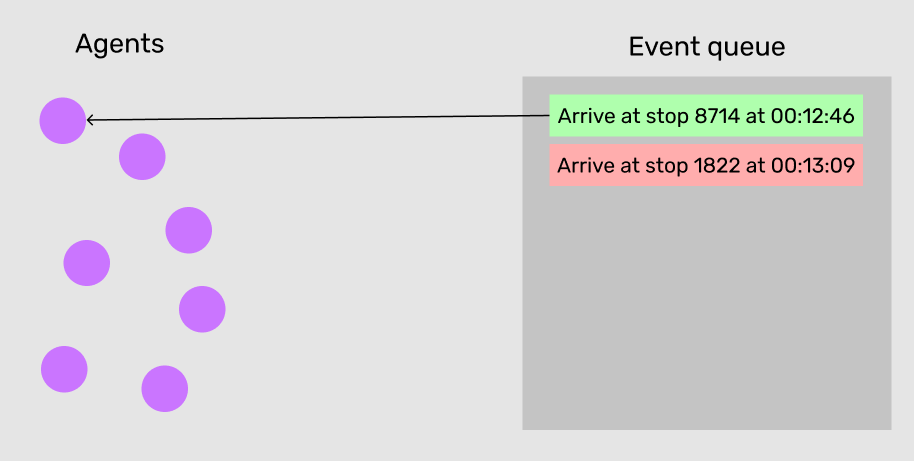
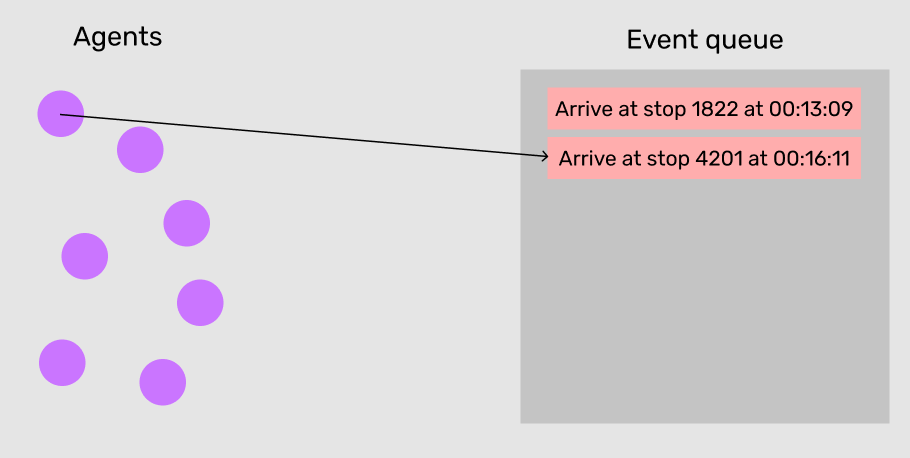
In discrete event simulation, instead of ticking through fixed-interval time steps (like in a video game), we schedule salient events into a sorted queue and process them in order one-by-one.
Discrete event simulation
Discrete event simulation
Discrete event simulation
Discrete event simulation
Challenges
There were a lot of challenges in developing the prototype, that are all interrelated.
Performance limitations and memory constraints
- Population of 5.1 million, ideally could run simulation with 5.1 million agents
- Main bottleneck is routing
- CSA turned out to be the fastest
I experimented with my own routing algorithms (to better understand the problem) but in the end wasn't coming up with anything performant.
CSA was reported to be one of the fastest routing algorithms so that's what I went with. It's been some time since I looked at it, but it's remarkably simple. The algorithm basically takes a sorted list (according to departure time, earliest to latest) of all possible connections and iterates over that list, maintaining a record of what the earliest arrival to a given stop is. Once you finish that iteration (and there are conditions to stop early) you lookup which connection is the earliest to your destination stop, then which connection is earliest to that one, and so on, until you reach your departure stop.
I wrote a Python implementation which was still too slow, and ended up writing it in Cython for at least a 70x speed-up.
There is a variant of CSA where, because the transit schedule is more or less fixed, you can precompute every possible station-to-station trip for every departure time for a given transit system, and cache it. That way at runtime you don't do any computing, you just lookup the precomputed route given two stations. But it takes an enormous amount of memory to cache those routes.
I wondered how Google is able to process so many routing requests in such short amounts of time, which I assume is because a) they process requests in parallel and b) they have enough memory to cache every possible route computed by CSA.
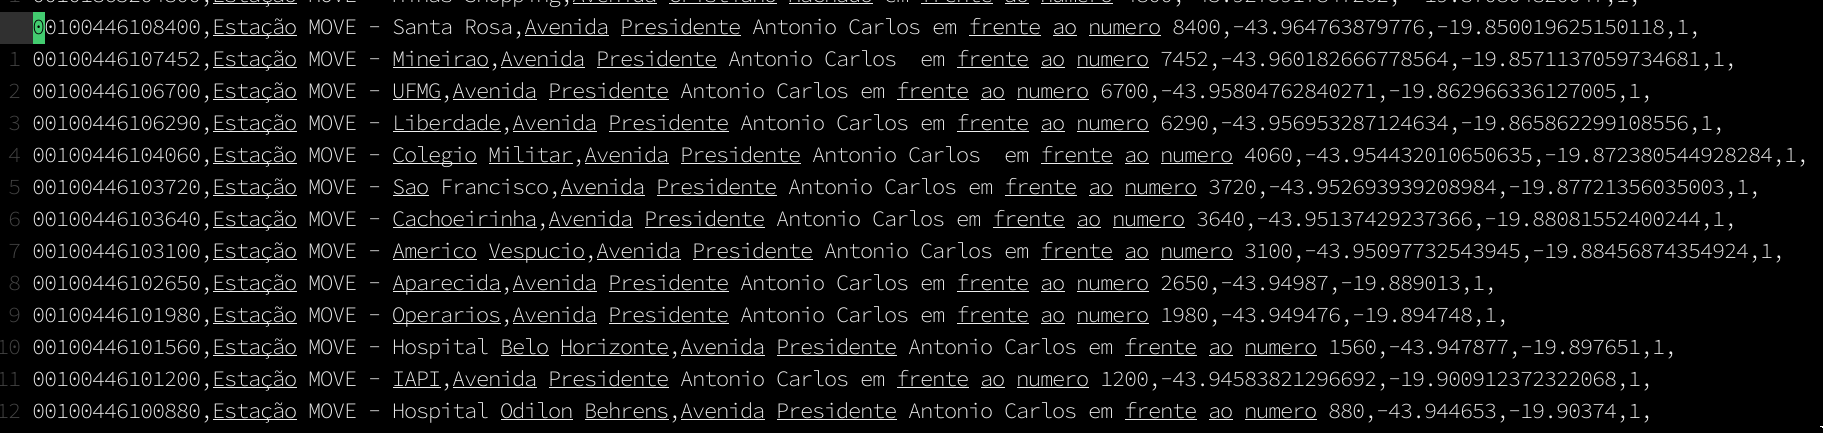
Mapping GTFS bus stops to the OSM road network
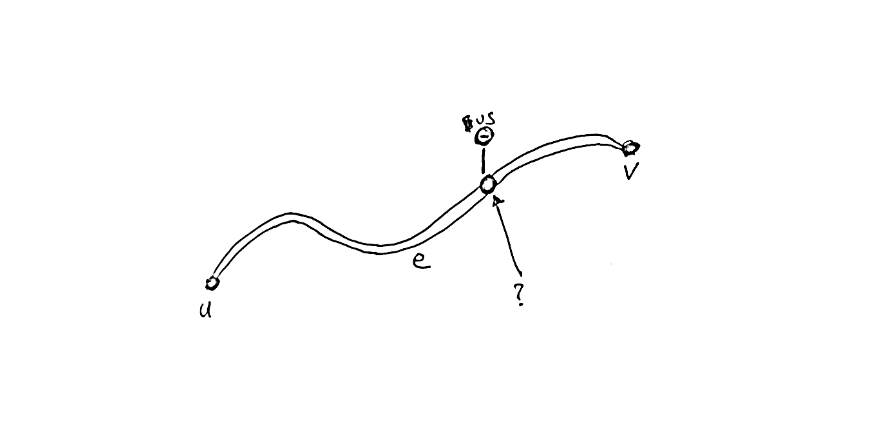
One specific problem which was interesting was relating GTFS bus stops to the road network.
The GTFS data includes stop descriptions, which usually include the road name, but it often includes other information or is not an exact match. Further, we don't want to only match a bus stop to the road it is on, but also where along that road it is. Fortunately the GTFS data also includes the coordinates of the stops.
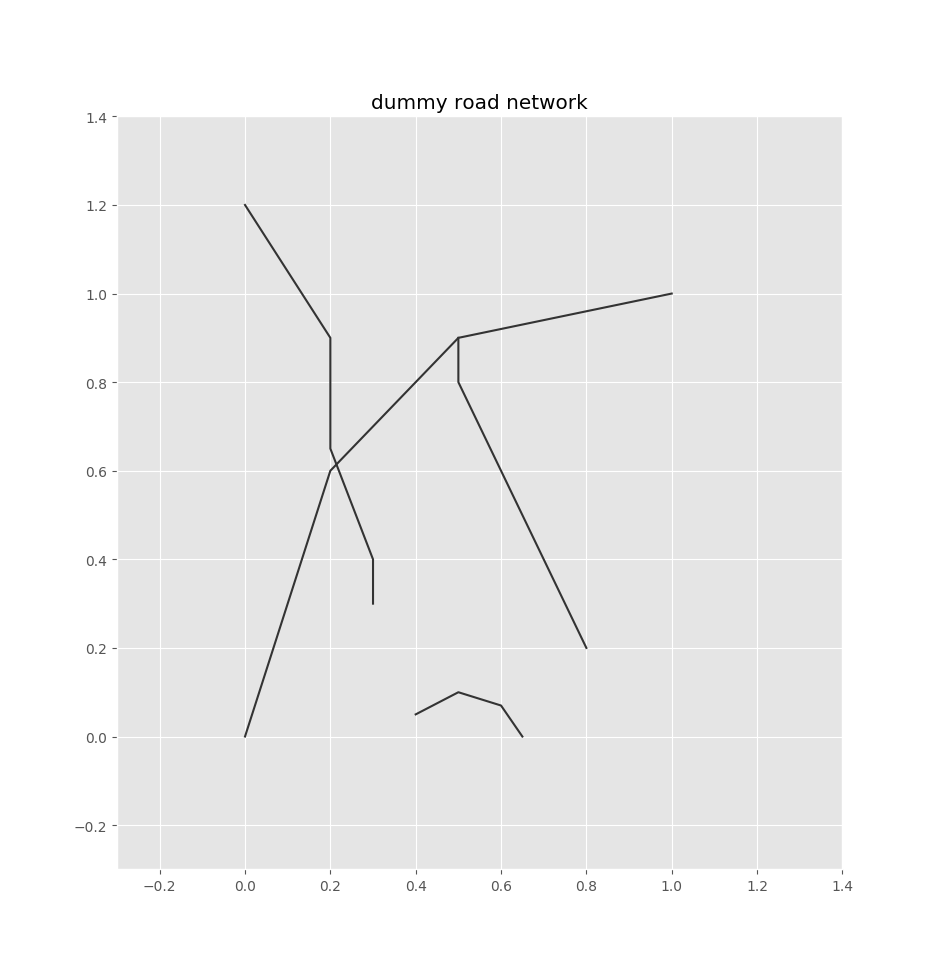
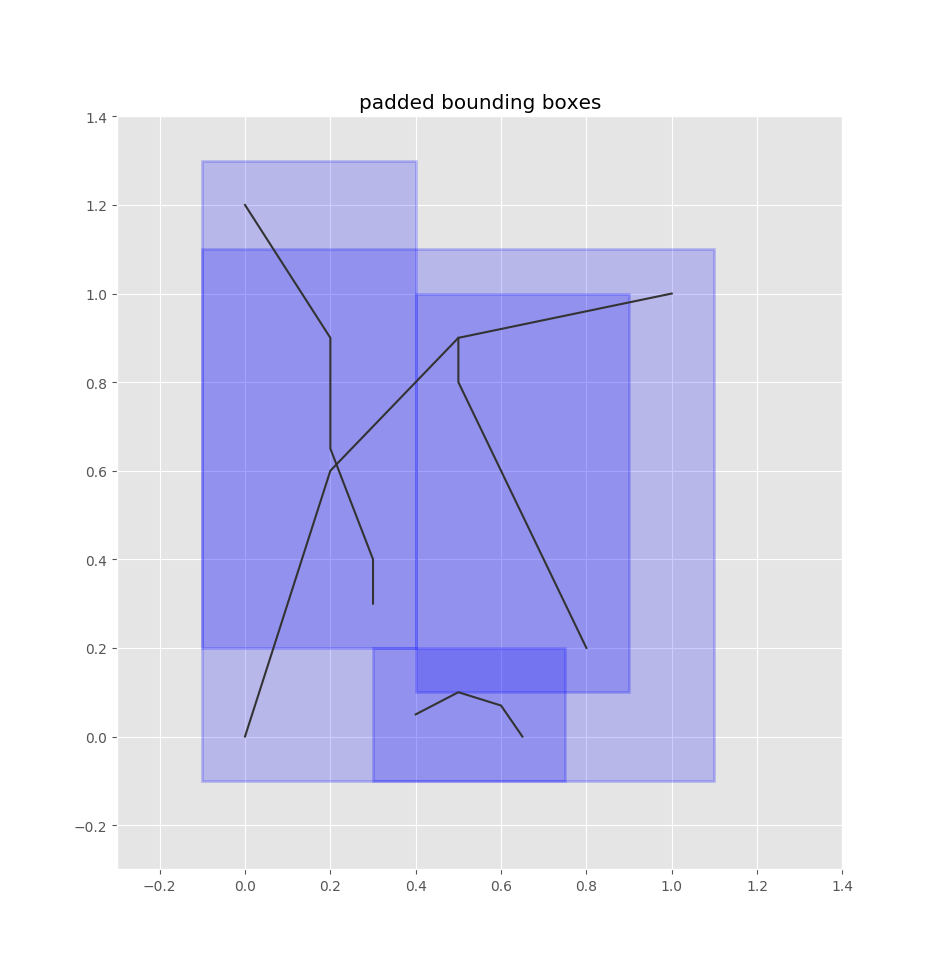
Given a road network, we index all the edges into a quadtree, which is a data structure that indexes 2d boxes so that you can quickly find the boxes that overlap with a query box.

Given a bus stop coordinate, we can treat it as a box by adding some padding around it.
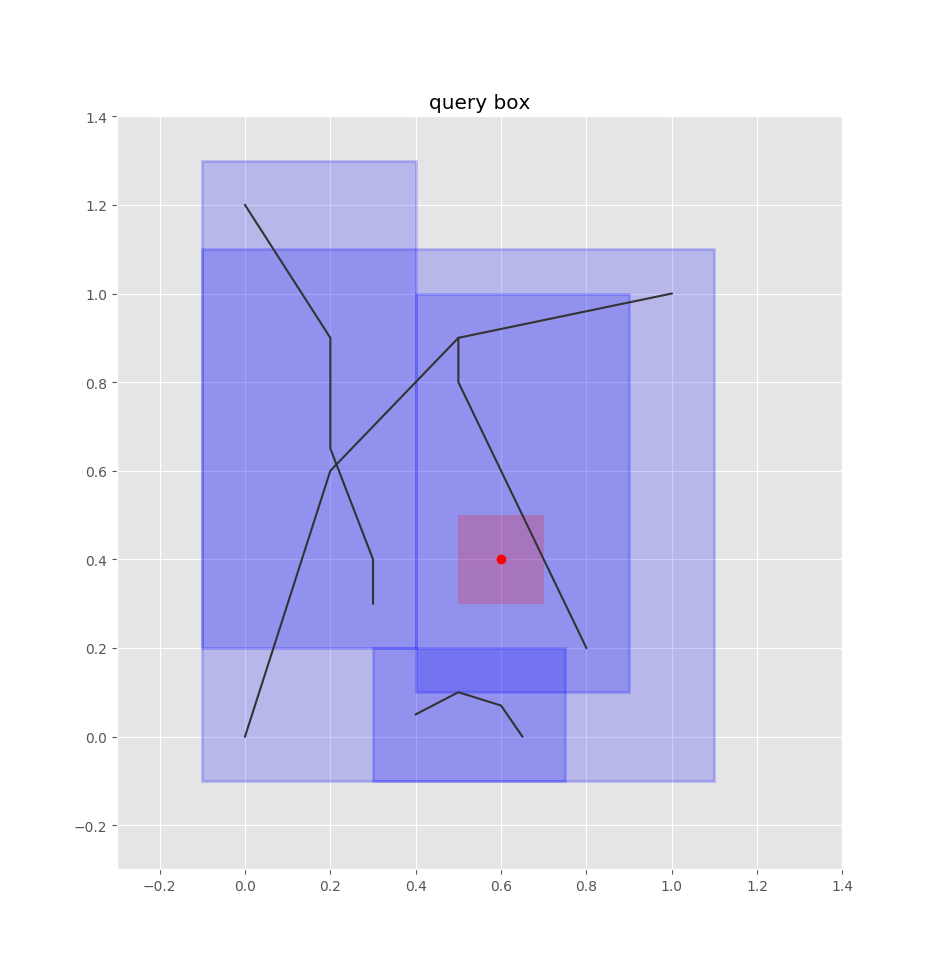

Then we can query the quadtree index for the overlapping edge-boxes.

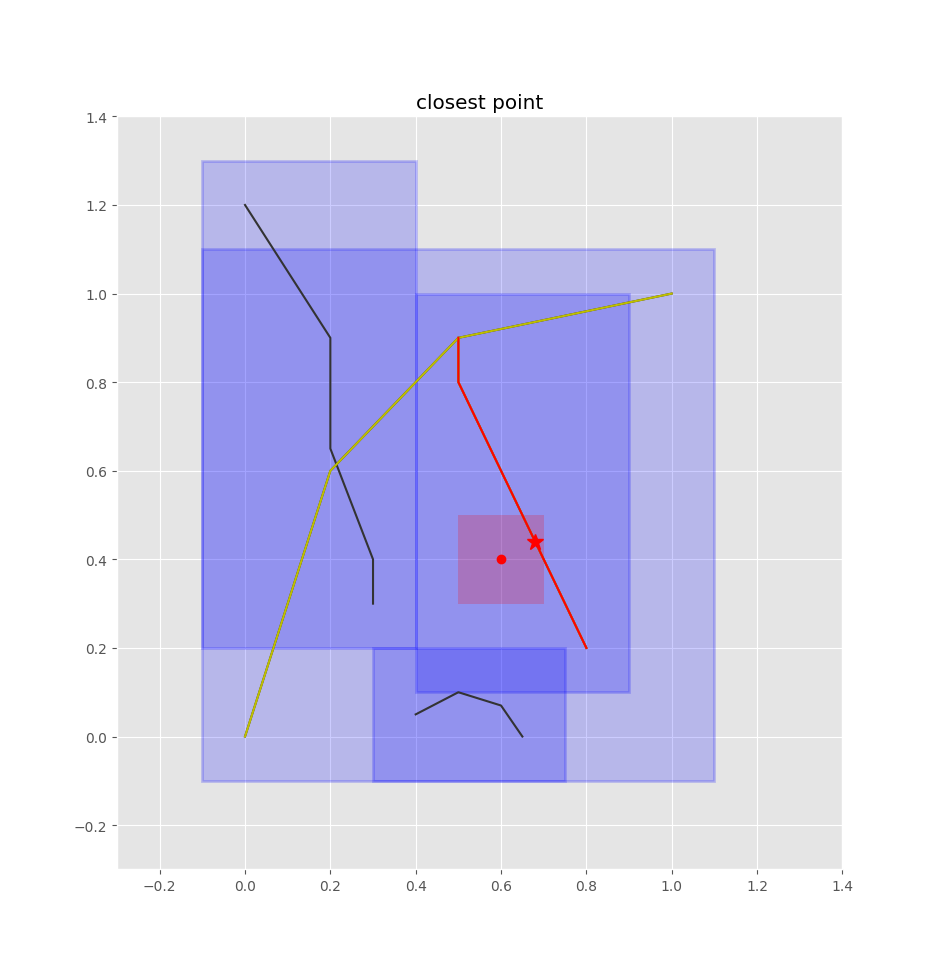
Then it's just a matter of checking the closest edges and projecting the query point onto each of those edges (such that we get a normalized 0-1 value of how far along the edge the point is, rather than its absolute position), then selecting the closest one of these points.
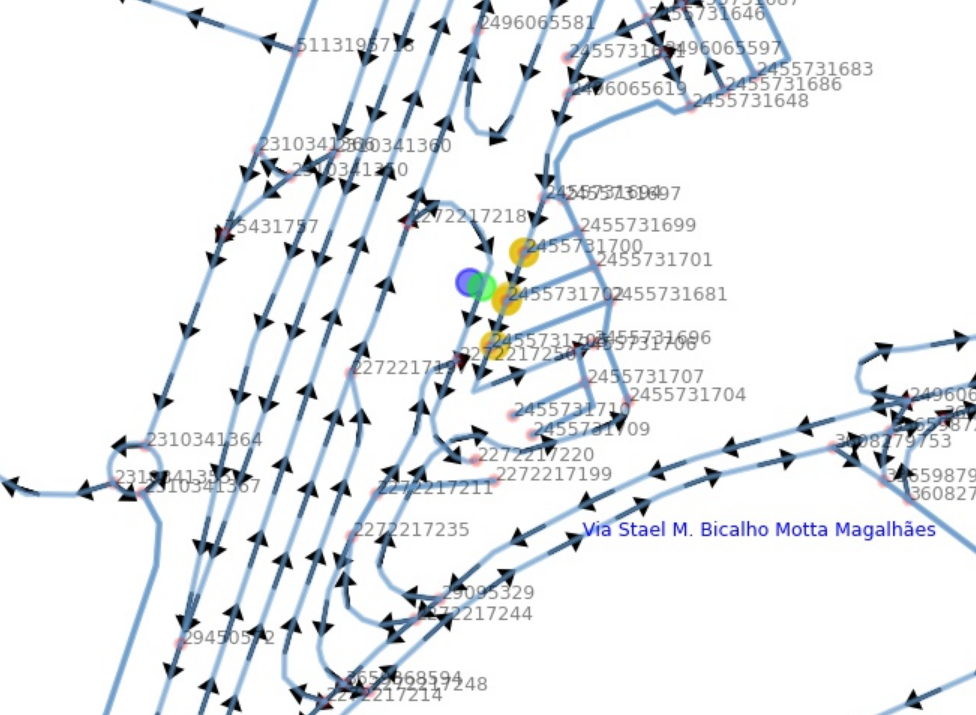
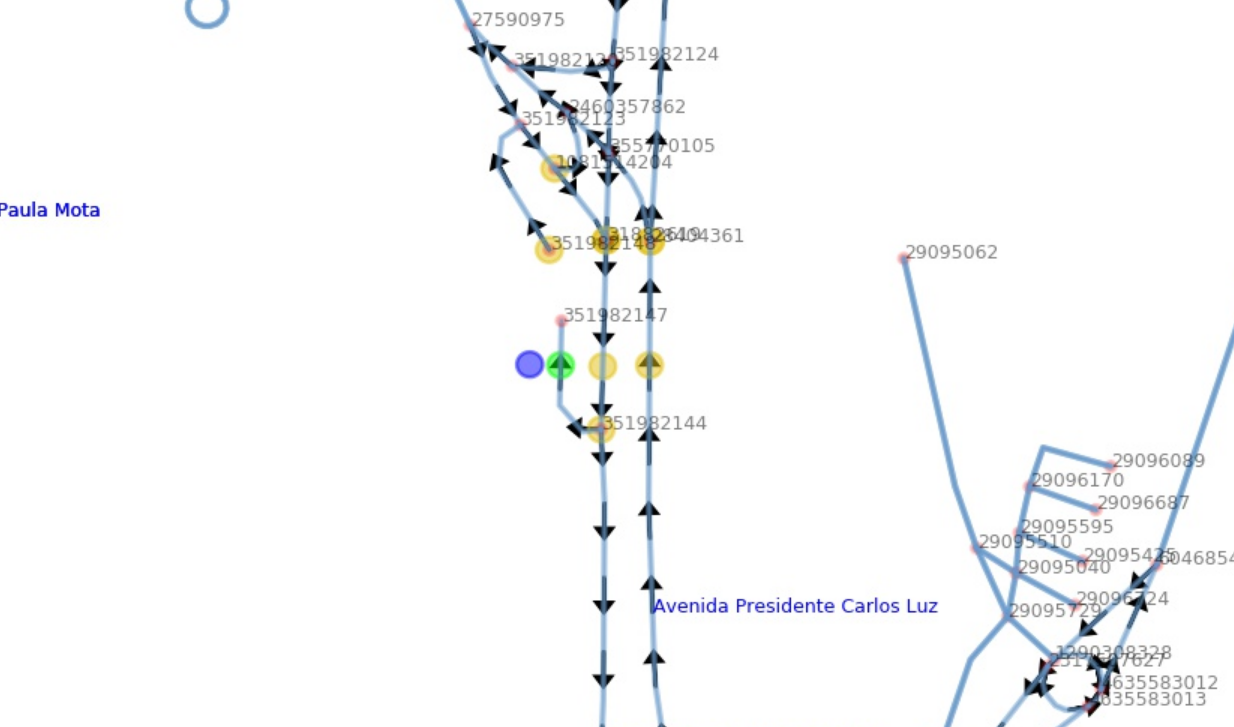
Not so fast...
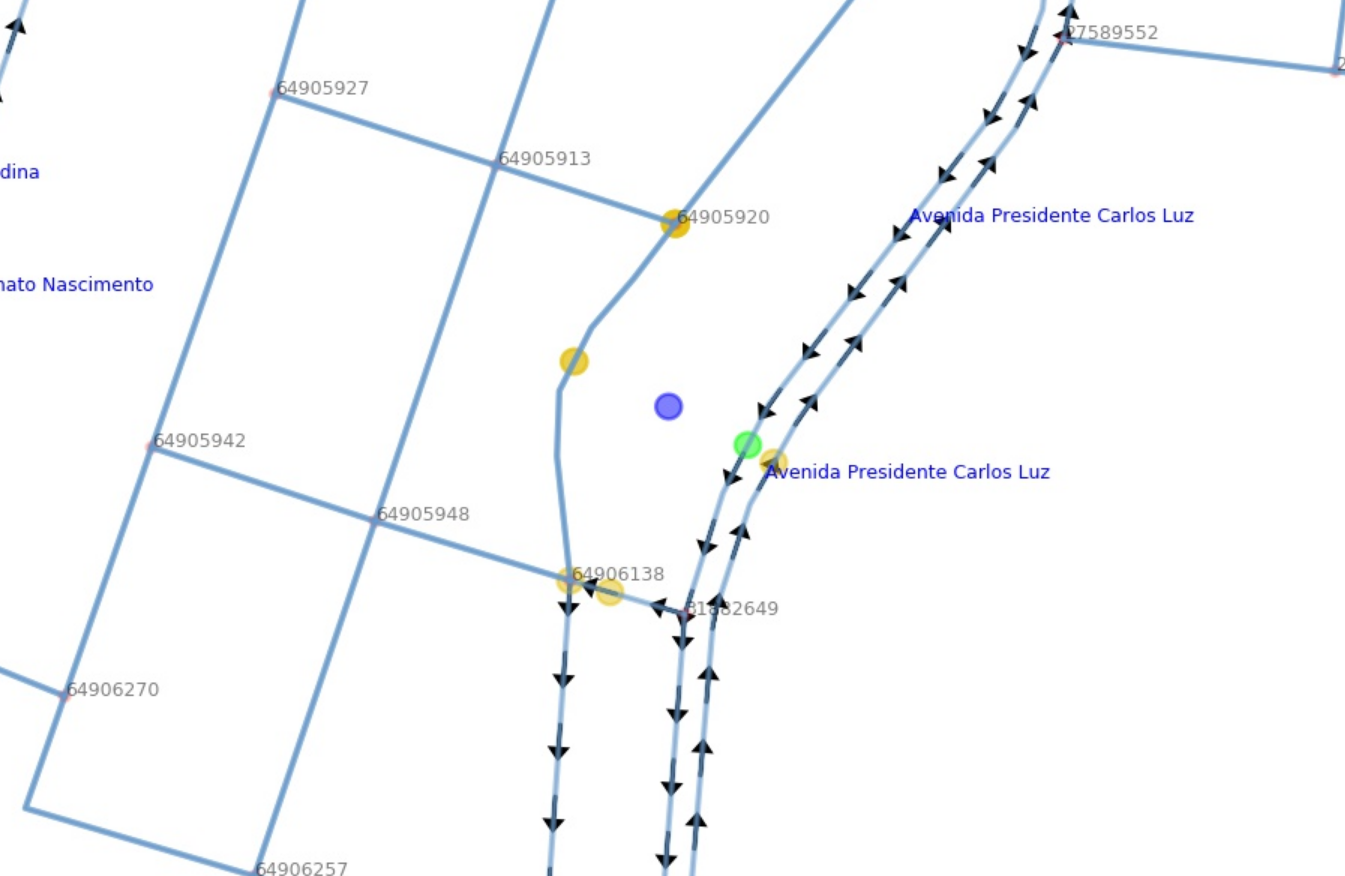
Ok, use bus stop descriptions to disambiguate
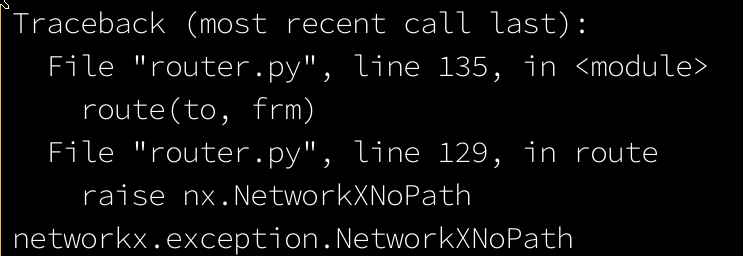
This came up a lot when routing buses according to their scheduled stops. We wanted buses to "travel" on the road network just like private transit, so they would be affected by congestion and so on. So we used the A-star planner to compute actual driving routes from stop to stop. We had no way of verifying if the computed route was indeed the route the bus actually drives, so we assumed that they take whatever the fastest route is. The problem was that occasionally no route could be found because the map was missing connections that were necessary to find a route. In those cases we just fallback to whatever the bus schedule says, removing the bus temporarily from the road network.


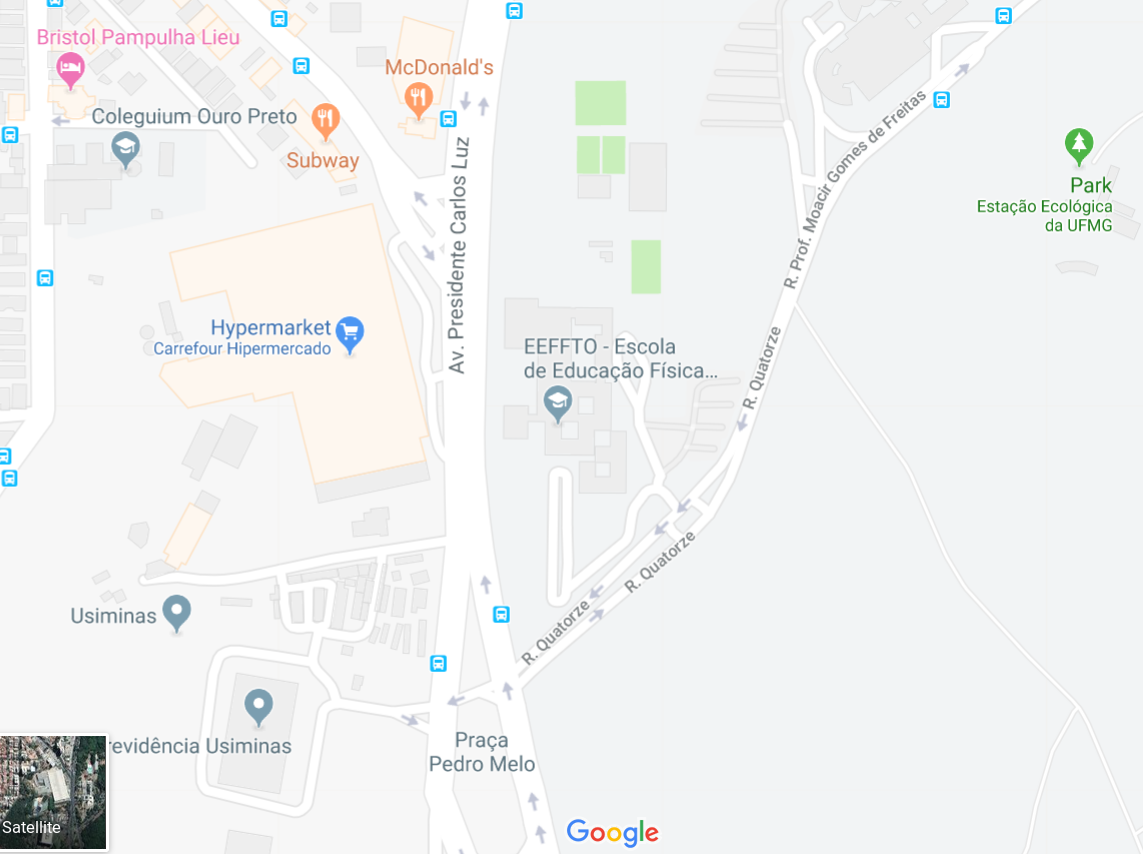
Inaccurate, incomplete, or out-of-date OSM/GTFS data
I'm sure this is a common pain point. This problem led to a lot of routing errors and also complicated other areas of the simulation. For example, a lot of lane information was missing (how many lanes, if any were reserved for buses), as was speed limit information. So we had to impute a lot of data, estimating speed limits based on roads that did have that information, for example.
These simulations...
- are contingent on available and quality data
- quickly get too complex to easily manage
Overall, it was a set of interesting challenges and I learned quite a lot. These models rely a lot on quality and available data, and easily become so complex that they become difficult to understand or manage. I'd love to hear about your experiences and strategies for dealing with these issues. Thank you.
Thank you
So we model how firms hire and fire people, how people seek work, how people make decisions around moving or buying/selling houses, and how tax policy influences these behaviors.